
2022-2027 Global and Regional Natural Sweeteners Industry Status and Prospects Professional Market Research Report Standard Version
Date: Jan-2022 | Id: MACRC-74416 | Geographical Scope: Global | Publisher: Mnemonics Research
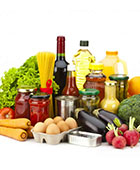
The global Natural Sweeteners market was valued at 2253.65 Million USD in 2021 and will grow with a CAGR of 3.5% from 2021 to 2027, based on Mnemonics Research newly published report.
The prime objective of this report is to provide the insights on the post COVID-19 impact which will help market players in this field evaluate their business approaches. Also, this report covers market segmentation by major market verdors, types, applications/end users and geography(North America, East Asia, Europe, South Asia, Southeast Asia, Middle East, Africa, Oceania, South America).
Natural sweeteners, in comparison to nonnutritive sweeteners, contain calories and nutrients, are metabolized, and change as they pass through the body. They include agave nectar, brown rice syrup, date sugar, honey, maple syrup, molasses and blackstrap molasses, sorghum syrup and stevia.The increasing demand for Natural Sweeteners drives the market. High disposable incomes and growing population are key drivers to boost the growth of Natural Sweeteners market. Advancement in technology and new product development is expected to bring about various improvements in sugar substitutes market. Increasing concerns towards growing health problems such as obesity and diabetes coupled with sugar taxes in numerous countries is likely to draw attention towards adopting non-caloric products based on natural sweeteners. Increasing prevalence of chronic diseases such as obesity and diabetes also lead to growth of market. Asia Pacific Excluding Japan (APEJ) is expected to remain dominant during the forecast period.
By Market Verdors:
Madhava Natural Sweeteners
Truvia
SweetLeaf Stevia
Tate & Lyle
Whole Earth Sweetener
Imperial Sugar
Herboveda
Sunwin Stevia International
Morita Kagaku Kogyo
ABF Ingredients
Evolva
Galam Group
GLG Lifetech
Merisant
Ohly
Pure Circle
Zevia

By Types:
High Intensity
Low Intensity

By Applications:
Bakery Goods
Sweet Spreads
Confectionery and Chewing Gums
Beverages
Dairy Products

Key Indicators Analysed
Market Players & Competitor Analysis: The report covers the key players of the industry including Company Profile, Product Specifications, Production Capacity/Sales, Revenue, Price and Gross Margin 2016-2027 & Sales with a thorough analysis of the market’s competitive landscape and detailed information on vendors and comprehensive details of factors that will challenge the growth of major market vendors.
Global and Regional Market Analysis: The report includes Global & Regional market status and outlook 2016-2027. Further the report provides break down details about each region & countries covered in the report. Identifying its sales, sales volume & revenue forecast. With detailed analysis by types and applications.
Market Trends: Market key trends which include Increased Competition and Continuous Innovations.
Opportunities and <b>Drivers:</b> Identifying the Growing Demands and New Technology
Porters Five Force Analysis: The report provides with the state of competition in industry depending on five basic forces: threat of new entrants, bargaining power of suppliers, bargaining power of buyers, threat of substitute products or services, and existing industry rivalry.

Key Reasons to Purchase
To gain insightful analyses of the market and have comprehensive understanding of the global  market and its commercial landscape.
Assess the production processes, major issues, and solutions to mitigate the development risk.
To understand the most affecting driving and restraining forces in the market and its impact in the global market.
Learn about the market strategies that are being adopted by leading respective organizations.
To understand the future outlook and prospects for the market.
Besides the standard structure reports, we also provide custom research according to specific requirements.
Chapter 1 Industry Overview
1.1 Definition
1.2 Assumptions
1.3 Research Scope
1.4 Market Analysis by Regions
1.4.1 North America Market States and Outlook (2022-2027)
1.4.2 East Asia Market States and Outlook (2022-2027)
1.4.3 Europe Market States and Outlook (2022-2027)
1.4.4 South Asia Market States and Outlook (2022-2027)
1.4.5 Southeast Asia Market States and Outlook (2022-2027)
1.4.6 Middle East Market States and Outlook (2022-2027)
1.4.7 Africa Market States and Outlook (2022-2027)
1.4.8 Oceania Market States and Outlook (2022-2027)
1.4.9 South America Market States and Outlook (2022-2027)
1.5 Global Natural Sweeteners Market Size Analysis from 2022 to 2027
1.5.1 Global Natural Sweeteners Market Size Analysis from 2022 to 2027 by Consumption Volume
1.5.2 Global Natural Sweeteners Market Size Analysis from 2022 to 2027 by Value
1.5.3 Global Natural Sweeteners Price Trends Analysis from 2022 to 2027
1.6 COVID-19 Outbreak: Natural Sweeteners Industry Impact
Chapter 2 Global Natural Sweeteners Competition by Types, Applications, and Top Regions and Countries
2.1 Global Natural Sweeteners (Volume and Value) by Type
2.1.1 Global Natural Sweeteners Consumption and Market Share by Type (2016-2021)
2.1.2 Global Natural Sweeteners Revenue and Market Share by Type (2016-2021)
2.2 Global Natural Sweeteners (Volume and Value) by Application
2.2.1 Global Natural Sweeteners Consumption and Market Share by Application (2016-2021)
2.2.2 Global Natural Sweeteners Revenue and Market Share by Application (2016-2021)
2.3 Global Natural Sweeteners (Volume and Value) by Regions
2.3.1 Global Natural Sweeteners Consumption and Market Share by Regions (2016-2021)
2.3.2 Global Natural Sweeteners Revenue and Market Share by Regions (2016-2021)
Chapter 3 Production Market Analysis
3.1 Global Production Market Analysis
3.1.1 2016-2021 Global Capacity, Production, Capacity Utilization Rate, Ex-Factory Price, Revenue, Cost, Gross and Gross Margin Analysis
3.1.2 2016-2021 Major Manufacturers Performance and Market Share
3.2 Regional Production Market Analysis
3.2.1 2016-2021 Regional Market Performance and Market Share
3.2.2 North America Market
3.2.3 East Asia Market
3.2.4 Europe Market
3.2.5 South Asia Market
3.2.6 Southeast Asia Market
3.2.7 Middle East Market
3.2.8 Africa Market
3.2.9 Oceania Market
3.2.10 South America Market
3.2.11 Rest of the World Market
Chapter 4 Global Natural Sweeteners Sales, Consumption, Export, Import by Regions (2016-2021)
4.1 Global Natural Sweeteners Consumption by Regions (2016-2021)
4.2 North America Natural Sweeteners Sales, Consumption, Export, Import (2016-2021)
4.3 East Asia Natural Sweeteners Sales, Consumption, Export, Import (2016-2021)
4.4 Europe Natural Sweeteners Sales, Consumption, Export, Import (2016-2021)
4.5 South Asia Natural Sweeteners Sales, Consumption, Export, Import (2016-2021)
4.6 Southeast Asia Natural Sweeteners Sales, Consumption, Export, Import (2016-2021)
4.7 Middle East Natural Sweeteners Sales, Consumption, Export, Import (2016-2021)
4.8 Africa Natural Sweeteners Sales, Consumption, Export, Import (2016-2021)
4.9 Oceania Natural Sweeteners Sales, Consumption, Export, Import (2016-2021)
4.10 South America Natural Sweeteners Sales, Consumption, Export, Import (2016-2021)
Chapter 5 North America Natural Sweeteners Market Analysis
5.1 North America Natural Sweeteners Consumption and Value Analysis
5.1.1 North America Natural Sweeteners Market Under COVID-19
5.2 North America Natural Sweeteners Consumption Volume by Types
5.3 North America Natural Sweeteners Consumption Structure by Application
5.4 North America Natural Sweeteners Consumption by Top Countries
5.4.1 United States Natural Sweeteners Consumption Volume from 2016 to 2021
5.4.2 Canada Natural Sweeteners Consumption Volume from 2016 to 2021
5.4.3 Mexico Natural Sweeteners Consumption Volume from 2016 to 2021
Chapter 6 East Asia Natural Sweeteners Market Analysis
6.1 East Asia Natural Sweeteners Consumption and Value Analysis
6.1.1 East Asia Natural Sweeteners Market Under COVID-19
6.2 East Asia Natural Sweeteners Consumption Volume by Types
6.3 East Asia Natural Sweeteners Consumption Structure by Application
6.4 East Asia Natural Sweeteners Consumption by Top Countries
6.4.1 China Natural Sweeteners Consumption Volume from 2016 to 2021
6.4.2 Japan Natural Sweeteners Consumption Volume from 2016 to 2021
6.4.3 South Korea Natural Sweeteners Consumption Volume from 2016 to 2021
Chapter 7 Europe Natural Sweeteners Market Analysis
7.1 Europe Natural Sweeteners Consumption and Value Analysis
7.1.1 Europe Natural Sweeteners Market Under COVID-19
7.2 Europe Natural Sweeteners Consumption Volume by Types
7.3 Europe Natural Sweeteners Consumption Structure by Application
7.4 Europe Natural Sweeteners Consumption by Top Countries
7.4.1 Germany Natural Sweeteners Consumption Volume from 2016 to 2021
7.4.2 UK Natural Sweeteners Consumption Volume from 2016 to 2021
7.4.3 France Natural Sweeteners Consumption Volume from 2016 to 2021
7.4.4 Italy Natural Sweeteners Consumption Volume from 2016 to 2021
7.4.5 Russia Natural Sweeteners Consumption Volume from 2016 to 2021
7.4.6 Spain Natural Sweeteners Consumption Volume from 2016 to 2021
7.4.7 Netherlands Natural Sweeteners Consumption Volume from 2016 to 2021
7.4.8 Switzerland Natural Sweeteners Consumption Volume from 2016 to 2021
7.4.9 Poland Natural Sweeteners Consumption Volume from 2016 to 2021
Chapter 8 South Asia Natural Sweeteners Market Analysis
8.1 South Asia Natural Sweeteners Consumption and Value Analysis
8.1.1 South Asia Natural Sweeteners Market Under COVID-19
8.2 South Asia Natural Sweeteners Consumption Volume by Types
8.3 South Asia Natural Sweeteners Consumption Structure by Application
8.4 South Asia Natural Sweeteners Consumption by Top Countries
8.4.1 India Natural Sweeteners Consumption Volume from 2016 to 2021
8.4.2 Pakistan Natural Sweeteners Consumption Volume from 2016 to 2021
8.4.3 Bangladesh Natural Sweeteners Consumption Volume from 2016 to 2021
Chapter 9 Southeast Asia Natural Sweeteners Market Analysis
9.1 Southeast Asia Natural Sweeteners Consumption and Value Analysis
9.1.1 Southeast Asia Natural Sweeteners Market Under COVID-19
9.2 Southeast Asia Natural Sweeteners Consumption Volume by Types
9.3 Southeast Asia Natural Sweeteners Consumption Structure by Application
9.4 Southeast Asia Natural Sweeteners Consumption by Top Countries
9.4.1 Indonesia Natural Sweeteners Consumption Volume from 2016 to 2021
9.4.2 Thailand Natural Sweeteners Consumption Volume from 2016 to 2021
9.4.3 Singapore Natural Sweeteners Consumption Volume from 2016 to 2021
9.4.4 Malaysia Natural Sweeteners Consumption Volume from 2016 to 2021
9.4.5 Philippines Natural Sweeteners Consumption Volume from 2016 to 2021
9.4.6 Vietnam Natural Sweeteners Consumption Volume from 2016 to 2021
9.4.7 Myanmar Natural Sweeteners Consumption Volume from 2016 to 2021
Chapter 10 Middle East Natural Sweeteners Market Analysis
10.1 Middle East Natural Sweeteners Consumption and Value Analysis
10.1.1 Middle East Natural Sweeteners Market Under COVID-19
10.2 Middle East Natural Sweeteners Consumption Volume by Types
10.3 Middle East Natural Sweeteners Consumption Structure by Application
10.4 Middle East Natural Sweeteners Consumption by Top Countries
10.4.1 Turkey Natural Sweeteners Consumption Volume from 2016 to 2021
10.4.2 Saudi Arabia Natural Sweeteners Consumption Volume from 2016 to 2021
10.4.3 Iran Natural Sweeteners Consumption Volume from 2016 to 2021
10.4.4 United Arab Emirates Natural Sweeteners Consumption Volume from 2016 to 2021
10.4.5 Israel Natural Sweeteners Consumption Volume from 2016 to 2021
10.4.6 Iraq Natural Sweeteners Consumption Volume from 2016 to 2021
10.4.7 Qatar Natural Sweeteners Consumption Volume from 2016 to 2021
10.4.8 Kuwait Natural Sweeteners Consumption Volume from 2016 to 2021
10.4.9 Oman Natural Sweeteners Consumption Volume from 2016 to 2021
Chapter 11 Africa Natural Sweeteners Market Analysis
11.1 Africa Natural Sweeteners Consumption and Value Analysis
11.1.1 Africa Natural Sweeteners Market Under COVID-19
11.2 Africa Natural Sweeteners Consumption Volume by Types
11.3 Africa Natural Sweeteners Consumption Structure by Application
11.4 Africa Natural Sweeteners Consumption by Top Countries
11.4.1 Nigeria Natural Sweeteners Consumption Volume from 2016 to 2021
11.4.2 South Africa Natural Sweeteners Consumption Volume from 2016 to 2021
11.4.3 Egypt Natural Sweeteners Consumption Volume from 2016 to 2021
11.4.4 Algeria Natural Sweeteners Consumption Volume from 2016 to 2021
11.4.5 Morocco Natural Sweeteners Consumption Volume from 2016 to 2021
Chapter 12 Oceania Natural Sweeteners Market Analysis
12.1 Oceania Natural Sweeteners Consumption and Value Analysis
12.2 Oceania Natural Sweeteners Consumption Volume by Types
12.3 Oceania Natural Sweeteners Consumption Structure by Application
12.4 Oceania Natural Sweeteners Consumption by Top Countries
12.4.1 Australia Natural Sweeteners Consumption Volume from 2016 to 2021
12.4.2 New Zealand Natural Sweeteners Consumption Volume from 2016 to 2021
Chapter 13 South America Natural Sweeteners Market Analysis
13.1 South America Natural Sweeteners Consumption and Value Analysis
13.1.1 South America Natural Sweeteners Market Under COVID-19
13.2 South America Natural Sweeteners Consumption Volume by Types
13.3 South America Natural Sweeteners Consumption Structure by Application
13.4 South America Natural Sweeteners Consumption Volume by Major Countries
13.4.1 Brazil Natural Sweeteners Consumption Volume from 2016 to 2021
13.4.2 Argentina Natural Sweeteners Consumption Volume from 2016 to 2021
13.4.3 Columbia Natural Sweeteners Consumption Volume from 2016 to 2021
13.4.4 Chile Natural Sweeteners Consumption Volume from 2016 to 2021
13.4.5 Venezuela Natural Sweeteners Consumption Volume from 2016 to 2021
13.4.6 Peru Natural Sweeteners Consumption Volume from 2016 to 2021
13.4.7 Puerto Rico Natural Sweeteners Consumption Volume from 2016 to 2021
13.4.8 Ecuador Natural Sweeteners Consumption Volume from 2016 to 2021
Chapter 14 Company Profiles and Key Figures in Natural Sweeteners Business
14.1 Madhava Natural Sweeteners
14.1.1 Madhava Natural Sweeteners Company Profile
14.1.2 Madhava Natural Sweeteners Natural Sweeteners Product Specification
14.1.3 Madhava Natural Sweeteners Natural Sweeteners Production Capacity, Revenue, Price and Gross Margin (2016-2021)
14.2 Truvia
14.2.1 Truvia Company Profile
14.2.2 Truvia Natural Sweeteners Product Specification
14.2.3 Truvia Natural Sweeteners Production Capacity, Revenue, Price and Gross Margin (2016-2021)
14.3 SweetLeaf Stevia
14.3.1 SweetLeaf Stevia Company Profile
14.3.2 SweetLeaf Stevia Natural Sweeteners Product Specification
14.3.3 SweetLeaf Stevia Natural Sweeteners Production Capacity, Revenue, Price and Gross Margin (2016-2021)
14.4 Tate & Lyle
14.4.1 Tate & Lyle Company Profile
14.4.2 Tate & Lyle Natural Sweeteners Product Specification
14.4.3 Tate & Lyle Natural Sweeteners Production Capacity, Revenue, Price and Gross Margin (2016-2021)
14.5 Whole Earth Sweetener
14.5.1 Whole Earth Sweetener Company Profile
14.5.2 Whole Earth Sweetener Natural Sweeteners Product Specification
14.5.3 Whole Earth Sweetener Natural Sweeteners Production Capacity, Revenue, Price and Gross Margin (2016-2021)
14.6 Imperial Sugar
14.6.1 Imperial Sugar Company Profile
14.6.2 Imperial Sugar Natural Sweeteners Product Specification
14.6.3 Imperial Sugar Natural Sweeteners Production Capacity, Revenue, Price and Gross Margin (2016-2021)
14.7 Herboveda
14.7.1 Herboveda Company Profile
14.7.2 Herboveda Natural Sweeteners Product Specification
14.7.3 Herboveda Natural Sweeteners Production Capacity, Revenue, Price and Gross Margin (2016-2021)
14.8 Sunwin Stevia International
14.8.1 Sunwin Stevia International Company Profile
14.8.2 Sunwin Stevia International Natural Sweeteners Product Specification
14.8.3 Sunwin Stevia International Natural Sweeteners Production Capacity, Revenue, Price and Gross Margin (2016-2021)
14.9 Morita Kagaku Kogyo
14.9.1 Morita Kagaku Kogyo Company Profile
14.9.2 Morita Kagaku Kogyo Natural Sweeteners Product Specification
14.9.3 Morita Kagaku Kogyo Natural Sweeteners Production Capacity, Revenue, Price and Gross Margin (2016-2021)
14.10 ABF Ingredients
14.10.1 ABF Ingredients Company Profile
14.10.2 ABF Ingredients Natural Sweeteners Product Specification
14.10.3 ABF Ingredients Natural Sweeteners Production Capacity, Revenue, Price and Gross Margin (2016-2021)
14.11 Evolva
14.11.1 Evolva Company Profile
14.11.2 Evolva Natural Sweeteners Product Specification
14.11.3 Evolva Natural Sweeteners Production Capacity, Revenue, Price and Gross Margin (2016-2021)
14.12 Galam Group
14.12.1 Galam Group Company Profile
14.12.2 Galam Group Natural Sweeteners Product Specification
14.12.3 Galam Group Natural Sweeteners Production Capacity, Revenue, Price and Gross Margin (2016-2021)
14.13 GLG Lifetech
14.13.1 GLG Lifetech Company Profile
14.13.2 GLG Lifetech Natural Sweeteners Product Specification
14.13.3 GLG Lifetech Natural Sweeteners Production Capacity, Revenue, Price and Gross Margin (2016-2021)
14.14 Merisant
14.14.1 Merisant Company Profile
14.14.2 Merisant Natural Sweeteners Product Specification
14.14.3 Merisant Natural Sweeteners Production Capacity, Revenue, Price and Gross Margin (2016-2021)
14.15 Ohly
14.15.1 Ohly Company Profile
14.15.2 Ohly Natural Sweeteners Product Specification
14.15.3 Ohly Natural Sweeteners Production Capacity, Revenue, Price and Gross Margin (2016-2021)
14.16 Pure Circle
14.16.1 Pure Circle Company Profile
14.16.2 Pure Circle Natural Sweeteners Product Specification
14.16.3 Pure Circle Natural Sweeteners Production Capacity, Revenue, Price and Gross Margin (2016-2021)
14.17 Zevia
14.17.1 Zevia Company Profile
14.17.2 Zevia Natural Sweeteners Product Specification
14.17.3 Zevia Natural Sweeteners Production Capacity, Revenue, Price and Gross Margin (2016-2021)
Chapter 15 Global Natural Sweeteners Market Forecast (2022-2027)
15.1 Global Natural Sweeteners Consumption Volume, Revenue and Price Forecast (2022-2027)
15.1.1 Global Natural Sweeteners Consumption Volume and Growth Rate Forecast (2022-2027)
15.1.2 Global Natural Sweeteners Value and Growth Rate Forecast (2022-2027)
15.2 Global Natural Sweeteners Consumption Volume, Value and Growth Rate Forecast by Region (2022-2027)
15.2.1 Global Natural Sweeteners Consumption Volume and Growth Rate Forecast by Regions (2022-2027)
15.2.2 Global Natural Sweeteners Value and Growth Rate Forecast by Regions (2022-2027)
15.2.3 North America Natural Sweeteners Consumption Volume, Revenue and Growth Rate Forecast (2022-2027)
15.2.4 East Asia Natural Sweeteners Consumption Volume, Revenue and Growth Rate Forecast (2022-2027)
15.2.5 Europe Natural Sweeteners Consumption Volume, Revenue and Growth Rate Forecast (2022-2027)
15.2.6 South Asia Natural Sweeteners Consumption Volume, Revenue and Growth Rate Forecast (2022-2027)
15.2.7 Southeast Asia Natural Sweeteners Consumption Volume, Revenue and Growth Rate Forecast (2022-2027)
15.2.8 Middle East Natural Sweeteners Consumption Volume, Revenue and Growth Rate Forecast (2022-2027)
15.2.9 Africa Natural Sweeteners Consumption Volume, Revenue and Growth Rate Forecast (2022-2027)
15.2.10 Oceania Natural Sweeteners Consumption Volume, Revenue and Growth Rate Forecast (2022-2027)
15.2.11 South America Natural Sweeteners Consumption Volume, Revenue and Growth Rate Forecast (2022-2027)
15.3 Global Natural Sweeteners Consumption Volume, Revenue and Price Forecast by Type (2022-2027)
15.3.1 Global Natural Sweeteners Consumption Forecast by Type (2022-2027)
15.3.2 Global Natural Sweeteners Revenue Forecast by Type (2022-2027)
15.3.3 Global Natural Sweeteners Price Forecast by Type (2022-2027)
15.4 Global Natural Sweeteners Consumption Volume Forecast by Application (2022-2027)
15.5 Natural Sweeteners Market Forecast Under COVID-19
Chapter 16 Conclusions
Research Methodology